
Web Portal for Mental Health and Social Media
Your task is to create an Adobe web page about design approaches to better physical or mental health/happiness while still using digital devices, specifically internet & social media.
What is human Happiness or Well Being
To do this, you must develop a deeper understanding of some pathways to human happiness based on meeting basic needs. You can begin with Hari’s research, and other articles about antidotes to depression, or pathways to happiness, and develop a list of resources that helps your team come up with some good information you’d be interested in sharing with other college students. You may use any resources from the class website, and you will also need to add plenty of your own resources and research as well.
Social Media & Well Being
Next, you should assess if/when social media meets theses needs (and if so, superficially or deeply).
Once you have a sense of what might help college students like yourself attain more happiness, and the ways social media can contribute or detract from it, you are ready to begin.
Create a Web Page using Adobe Express Web Page that will help your audience learn what they need to answer three basic questions:
- Define Needs: What basic human needs (fulfilled or at least addressed) will contribute to increasing my happiness?
- Clarify the Problem: How can social media relate to this? Should I use more? Less? Only certain kinds? Certain times? A better, re-designed app (see mental health apps in schedule)? Only under certain conditions etc. OR
- Propose Design Solution: Suggest solutions that will have a real effect on the quality of your life. The solution can be both digital and behavioral–how you use the tech and for what and when. Go beyond simple fixes here–get creative. Invent better platforms.
Make sure you cite ALL your sources, eg class, professor, music etc in your final credits. For your post, use category: Task 5-Yourname, a relevant featured image, a brief description in text and your Adobe Express Page URL.
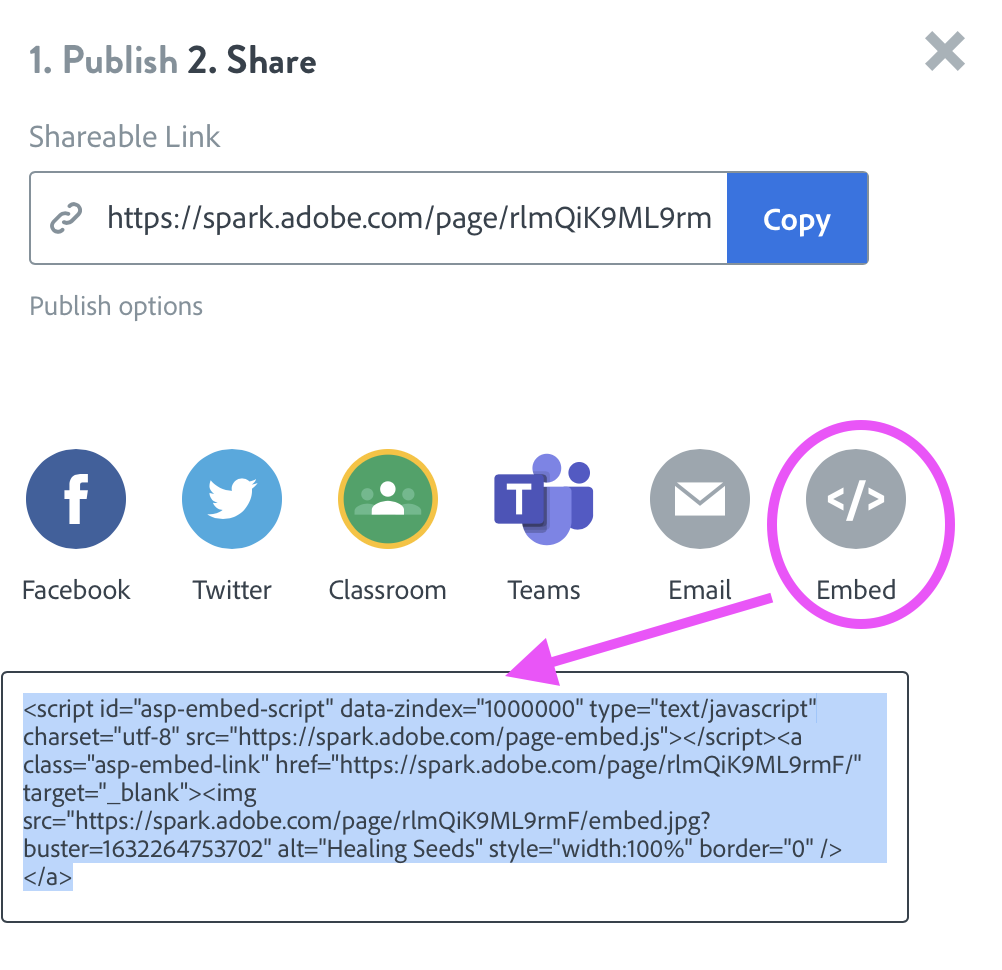
Adobe Express Page has a share feature that allows you to publish and copy your URL, using the Publish–>Share–>Copy URL option. Use a key image from your project with a width of 1024 px, and make an image link using your Adobe Express Page URL.
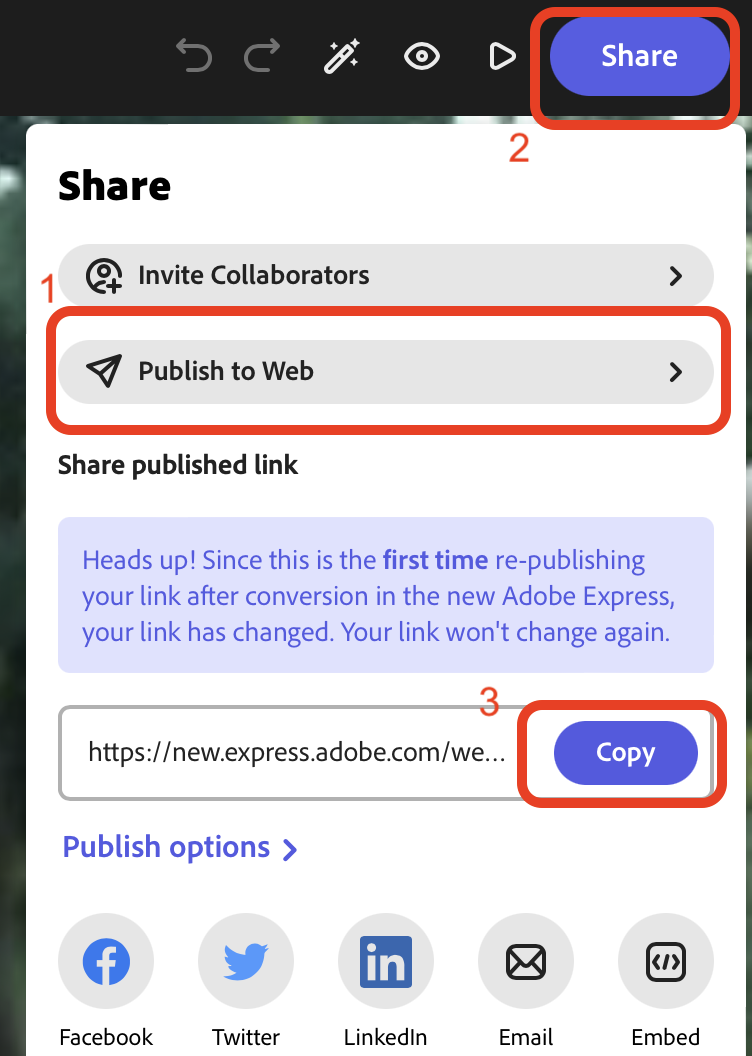
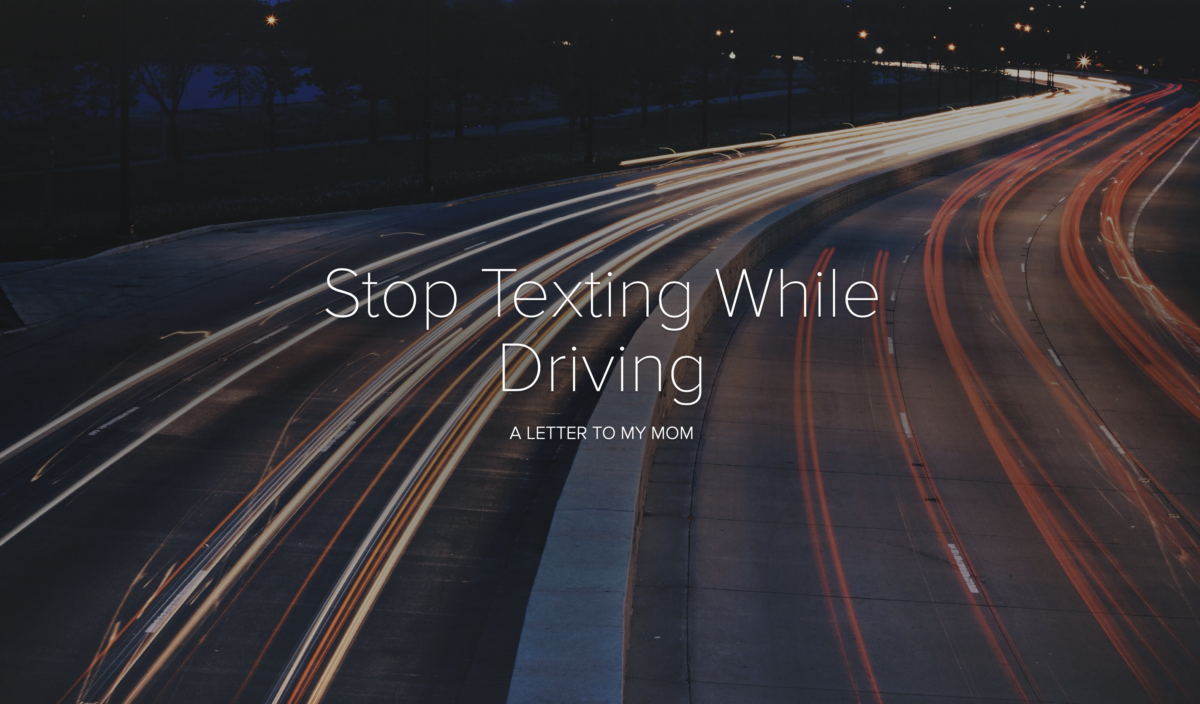
Below is very simple web page about Texting & Driving. It uses an image link–to do this Add your image, then elect it, and click on the link icon (looks like a chain) above in the WYSIWIG editor. Paste your URL & save.
